Efficiently plotting very large datasets with concatenated hex plots
For my current project, I need to generate 5 plots, each of which contain approximately 1.5 billion datapoints. I haven’t tried, but that is likely to seriously cramp my laptops style. The data points are divided amongst 12,000 participants. Since these will get plotted as a hex-mapped density plot anyway, I want to generate hex plot information for each subject individually and then effectively stack them in a memory efficient way. As an added complication, I want to plot a best fit line over the graph.
Generate Data and example plots
N=10000
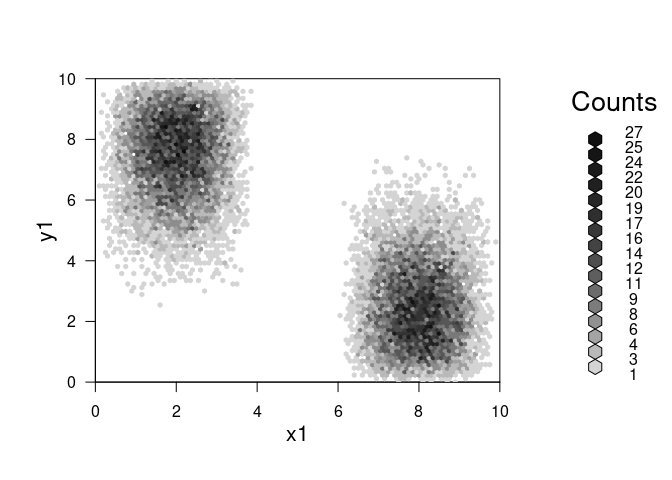
x1<-rpert(N,0,2,4,shape=5)
y1<-rpert(N,2,8,10,shape=5)
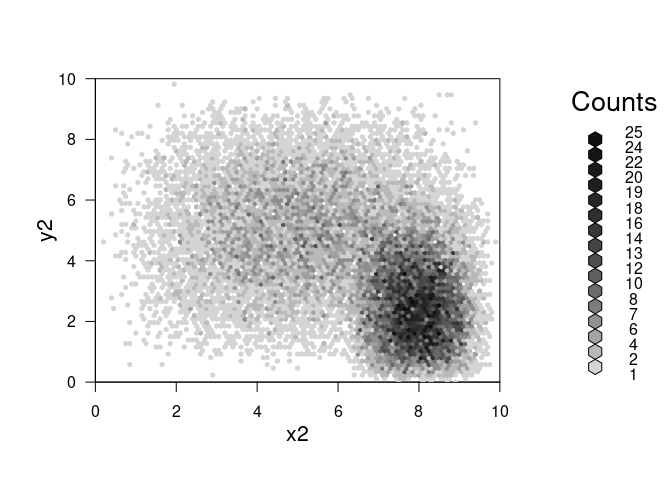
x2<-rpert(N,6,8,10,shape=5)
y2<-rpert(N,0,2,8,shape=5)
x3<-rpert(N,0,5,10,shape=5)
y3<-rpert(N,0,5,10,shape=5)
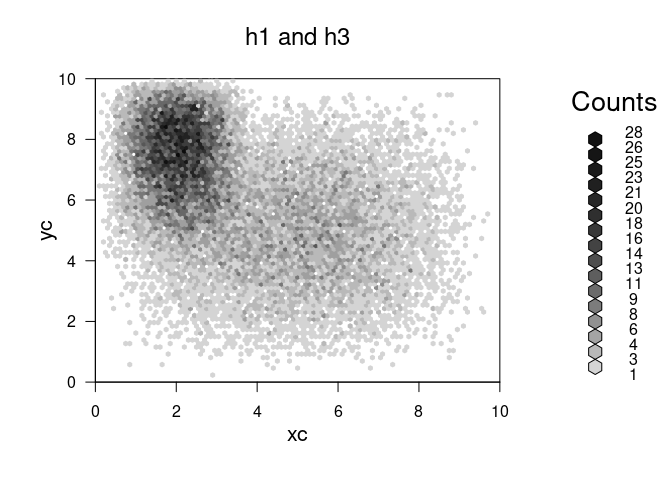
xc<-c(x1,x3)
yc<-c(y1,y3)
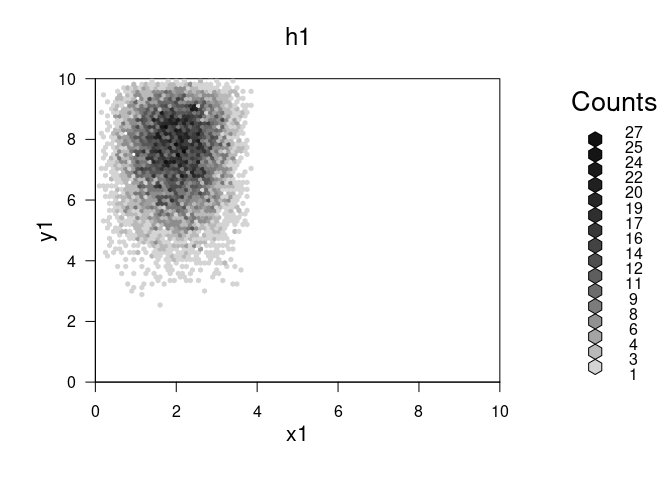
h1<-hexbin(x1,y1,xbnds=c(0,10),ybnds=c(0,10),xbins=100,shape=.75)
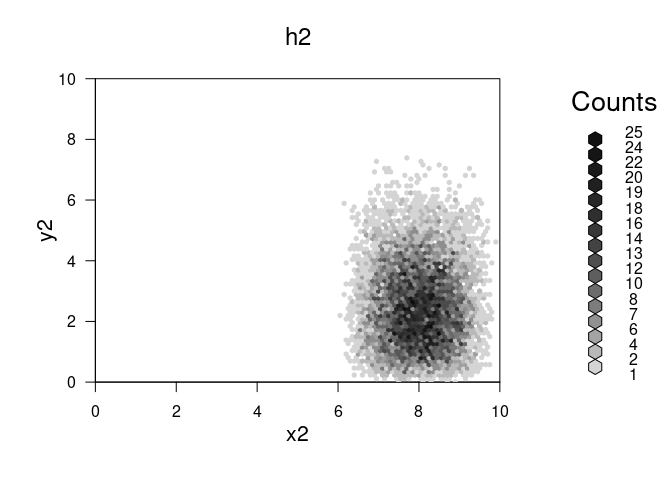
h2<-hexbin(x2,y2,xbnds=c(0,10),ybnds=c(0,10),xbins=100,shape=.75)
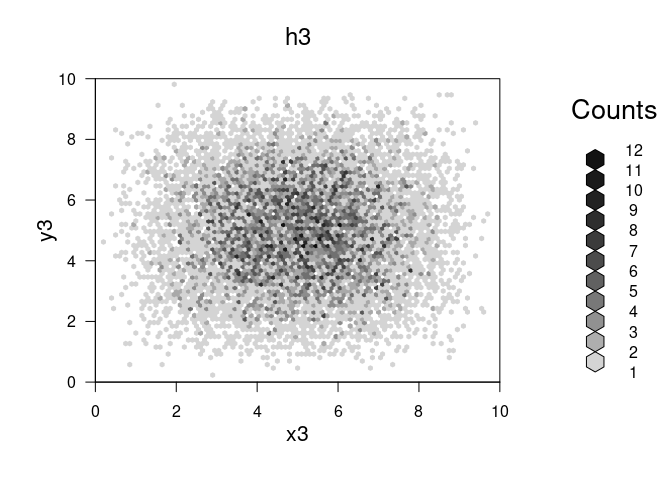
h3<-hexbin(x3,y3,xbnds=c(0,10),ybnds=c(0,10),xbins=100,shape=.75)
hc<-hexbin(xc,yc,xbnds=c(0,10),ybnds=c(0,10),xbins=100,shape=.75)
plot(h1,main="h1")
plot(h2,main="h2")
plot(h3,main="h3")
plot(hc,main="h1 and h3")
The goal
What we want to do is combine the hexbins without storing the entire vector in memory.
The hexbin object seems to store cell ids and weights separately, which is great for us. On disk, the hex object is 4.3152^{4} bytes, whereas the original vectors were 1.60096^{5} bytes. So the hexbin object does not store the original data.
However:
- There is no c or ‘+’ method for hexbin. I could not get the list2hexList function to plot (and it saves too much data anyway).
- It’s not clear how the cell ids are mapped to coordinates.
Given the bounding arguments we’re providing, the hexbin objects have the same grid dimensions, but different numbers of cells:
c(h1,h2,h3)
## [[1]]
## 'hexbin' object from call: hexbin(x = x1, y = y1, xbins = 100, shape = 0.75, xbnds = c(0,      10), ybnds = c(0, 10))
## n = 10000  points in nc = 1593  hexagon cells in grid dimensions  88 by 101
##
## [[2]]
## 'hexbin' object from call: hexbin(x = x2, y = y2, xbins = 100, shape = 0.75, xbnds = c(0,      10), ybnds = c(0, 10))
## n = 10000  points in nc = 1619  hexagon cells in grid dimensions  88 by 101
##
## [[3]]
## 'hexbin' object from call: hexbin(x = x3, y = y3, xbins = 100, shape = 0.75, xbnds = c(0,      10), ybnds = c(0, 10))
## n = 10000  points in nc = 3988  hexagon cells in grid dimensions  88 by 101
It appears that the cell id’s are mapped to the grid. You can tell by making a table of overlapping cell id’s from the above hexbin objects:
#How much overlap?
celllist<-list(h1@cell,h2@cell,h3@cell)
outer(celllist,celllist,Vectorize(\(x,y) sum(x %in% y)))
##      [,1] [,2] [,3]
## [1,] 1593    0  731
## [2,]    0 1619  758
## [3,]  731  758 3988
h1 and h2 have no shared cell id’s – but h3 overlaps with both 1 and 2. This is JUST what we would expect if the cell ids line up with a particular coordinate. Next question – do overlapping cells have the same cell id?
#find 5 cells which overlap between h2 and h3
tcells<-h2@cell[which(h2@cell %in% h3@cell)[1:5]]
h2xy<-hcell2xy(h2)
h3xy<-hcell2xy(h3)

data.frame(h2cellid=h2@cell[h2@cell %in% tcells],
           h3cellid=h3@cell[h3@cell %in% tcells],
           x2=h2xy$x[h2@cell %in% tcells],
           x3=h3xy$x[h3@cell %in% tcells],
           y2=h2xy$y[h2@cell %in% tcells],
           y3=h3xy$y[h3@cell %in% tcells])
##   h2cellid h3cellid   x2   x3        y2        y3
## 1      473      473 6.80 6.80 0.4618802 0.4618802
## 2      579      579 7.35 7.35 0.5773503 0.5773503
## 3      673      673 6.60 6.60 0.6928203 0.6928203
## 4      772      772 6.45 6.45 0.8082904 0.8082904
## 5      776      776 6.85 6.85 0.8082904 0.8082904
Cell ids map to specific points on an integer grid defining the possible hexes. Now we can make our function by simply merging the slots in the hexbin object on cell id. To be extra careful, we will use the hcell2xy function to extract the x and y coordinates of each cell. We will use weighted averaging to re-calculate the x and y center of mass which is embedded, per cell, in the hexbin object.
# Get elements from s4 object by name
get_slots <- function(x,nm) Map(\(c) getElement(x, c), nm)

# Unpack hexbin data to be merged in to a dataframe
# Strictly speaking we don't need the xy coordinates, but it is a good error
# check if we have the computation time available.
unpack_hexbin <- function(x) {
  cols <- c("cell", "count", "xcm", "ycm")
  return(cbind(data.frame(get_slots(x,cols)),
                 hcell2xy(x)))
}

# Get columns from a dataframe that should not vary between hexbins to be
# merged.
getmeta_hexbin <- function(x) {
  varying=c("cell", "count", "xcm", "ycm", "call", "n", "ncells")
  other_slots <- setdiff(slotNames(x), varying)
  get_slots(x,other_slots)
}

# Center of mass calculation for two points, robust to missing data.
cm<-function(x1,x2,x1w,x2w) {
  i<-x1*x1w
  j<-x2*x2w
  w<-sum(x1w,x2w,na.rm=TRUE)
  return(sum(i,j,na.rm=TRUE)/w)
}

combine_hexbin <- function(a,b) {
    hm <- merge(unpack_hexbin(a),
                unpack_hexbin(b),
                by = c("cell","x","y"),
                all = TRUE)
    if(any(duplicated(hm$cell))) stop("Duplicate cell Id's detected: Do the hexbin objects have the same grid?")
    hm2 <- hm %>% rowwise() %>% mutate(
      count=sum(count.x,count.y,na.rm=TRUE),
      xcm=cm(xcm.x,xcm.y,count.x,count.y),
      ycm=cm(ycm.x,ycm.y,count.x,count.y)
    )
    do.call(new,
            c(list("hexbin"),
              as.list(hm2[,c("cell",
                             "count",
                             "xcm",
                             "ycm")]),
              list(n = sum(hm2$count),
                   ncells = length(hm2)),
              getmeta_hexbin(a),
              call = quote(call("merged hexbin", 1))
            ))
}

plot(combine_hexbin(h1,h2))
plot(combine_hexbin(h2,h3))
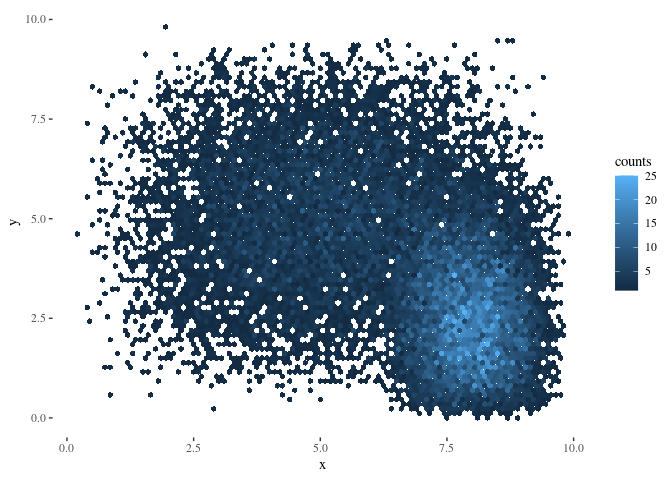
Great – what if we want to plot the resulting object in ggplot instead of base r plotting?
# from https://stackoverflow.com/questions/41903657/ggplot-hexbin-shows-different-number-of-hexagons-in-plot-versus-data-frame
stacked_hexbin<-combine_hexbin(h2,h3)
hexdf <- data.frame (hcell2xy(stacked_hexbin),
                     hexID = stacked_hexbin@cell,
                     counts = stacked_hexbin@count)

ggplot(hexdf,aes(x=x,y=y,fill=counts,hexID=hexID)) + geom_hex (stat="identity")