Concordance (Overlap) Plots in Freesurfer
Recently I had cause to create a concordance plot in Freesurfer: I had two overlay files from an analysis and I wanted to plot the significant regions in two colors with the overlapping area depicted in a third color. I found strikingly little documentation on how to do this outside of rumors in the FreeSurfer list serve, so I wanted to briefly document how I got it done. PySurfer is a great tool to use to do this, but I was unable to get its dependencies working in our analysis environment.
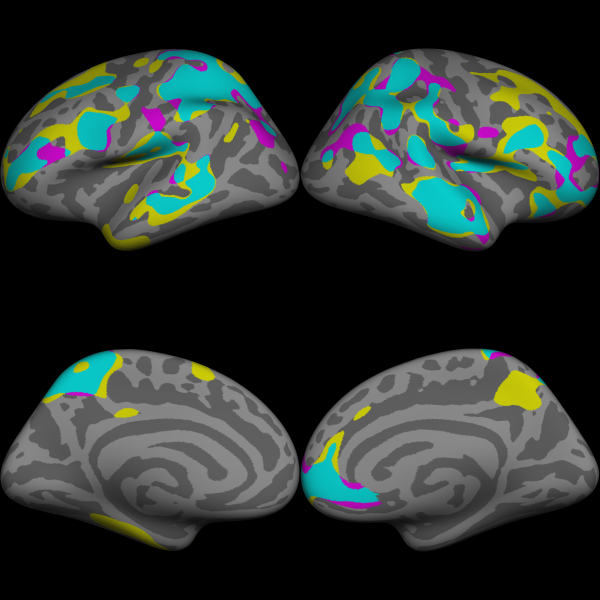
As a spoiler, here is a picture of the output visualized using a version of my quadfigures script:
How to make the figure
The basic approach is as follows:
- Using mri_binarize, make a mask of each of the overlays you want to depict. One should have masked voxels set to a value of 1, the other to 2.
- Using fscalc, sum these in to a third overlay volume. Now you have a volume where each overlay and their convergence have a unique value.
- Use mris_seg2annot, generate an overlay file from the combine volume as well using a color look up table you specify.
Here is an example script:
I used a Cyan-Yellow-Magenta color scheme as it is color-blind friendly.
Once the annotation file is generated, you can load it in freeview or tksurfer and work it in to a figure in whatever way you are used to. I use my quadfigure script.